


The general idea behind the trick goes like this: you set up tracing (and recording), start the application, and then do everything except the thing you are actually interested in. Then, you run the application again (with tracing and recording), but now you try to do only the thing you are after, touching other functions of the application as little as possible. And in the end you compare the traces - whatever is on the second list, but is not on the first one, is probably what we've been looking for.
In case of GDB and temporary breakpoints (which are one-shot, i.e. they become disabled after the first hit) it's even easier, as you can do this in a single run, first exploring all/some/most of the non-interesting functions, and then hitting the exact function you need, which in turn will display temporary breakpoint hits for whatever remaining breakpoints were still set.
So here's what I did (with pictures!):
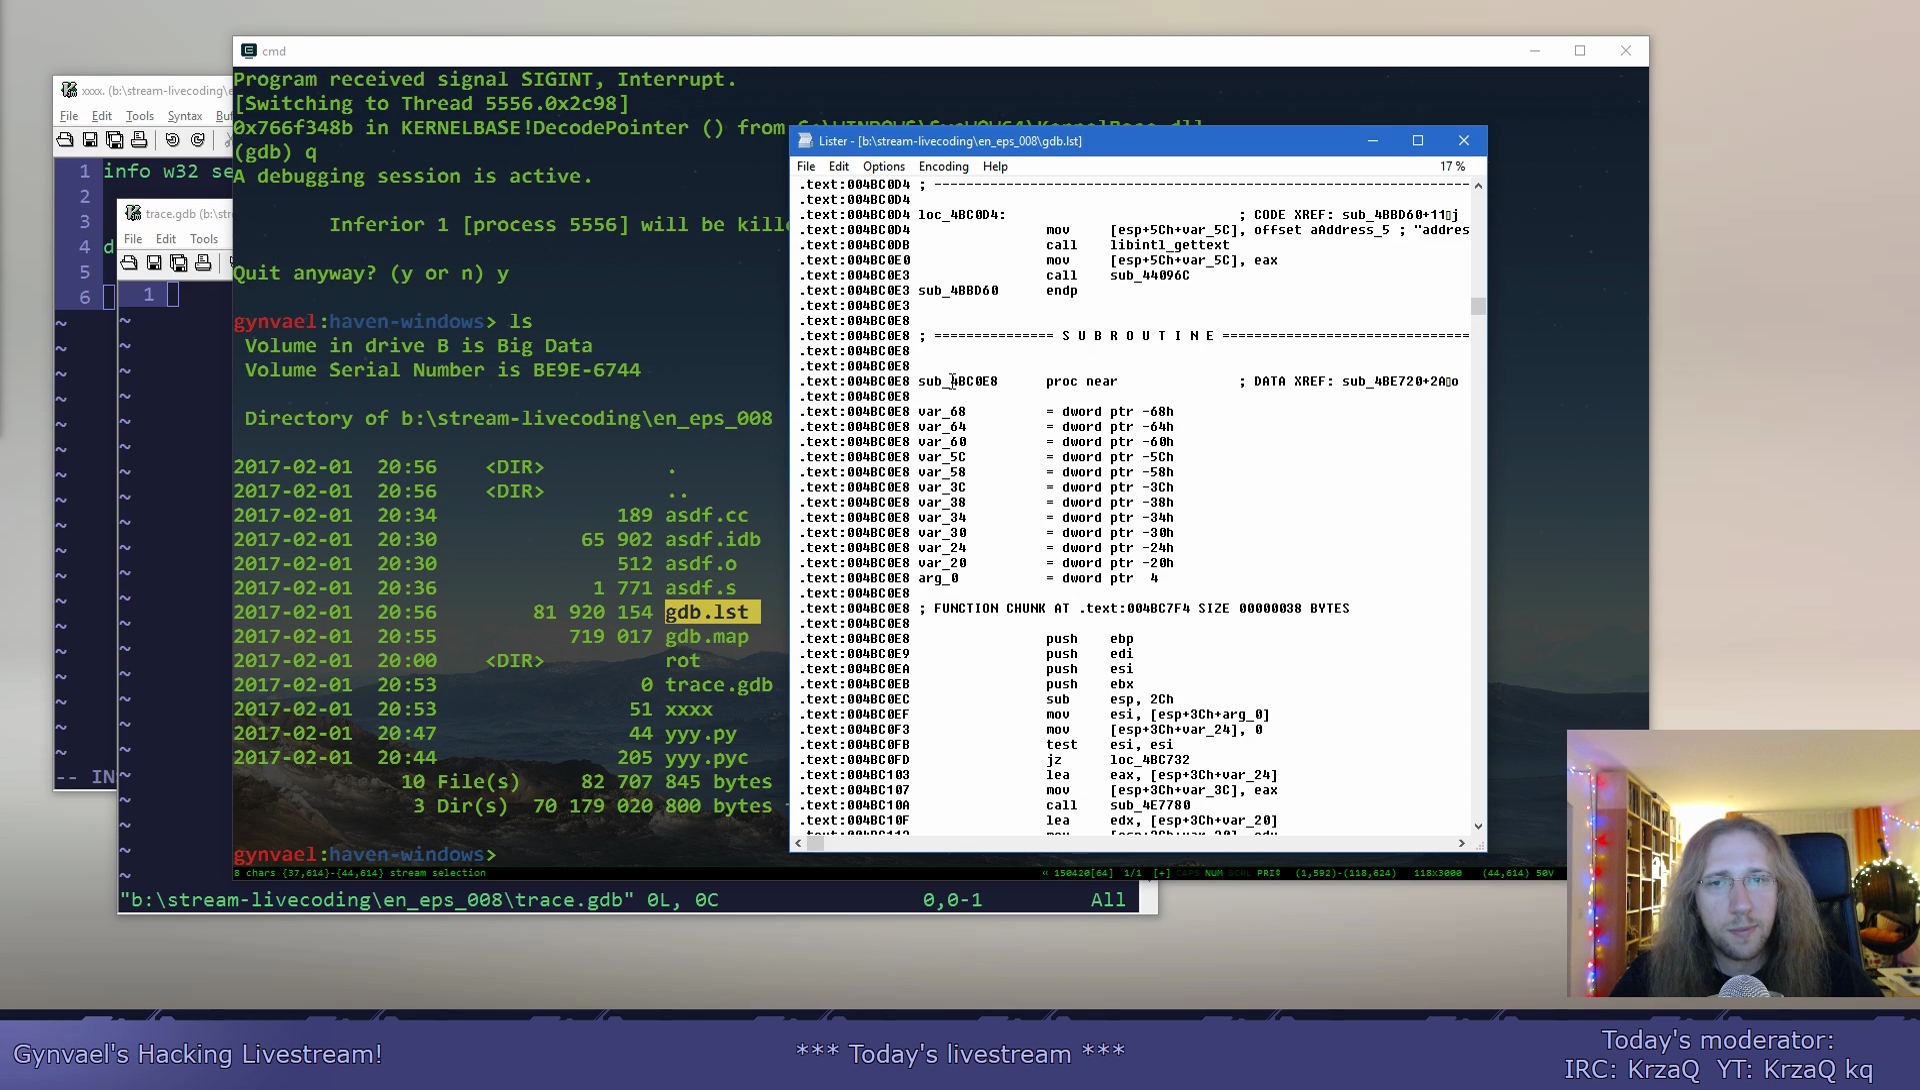
1. I've generated an LST file of the target application (well, the target was actually GDB as well) from IDA (which is basically a direct dump of what you see in the main screen of IDA).
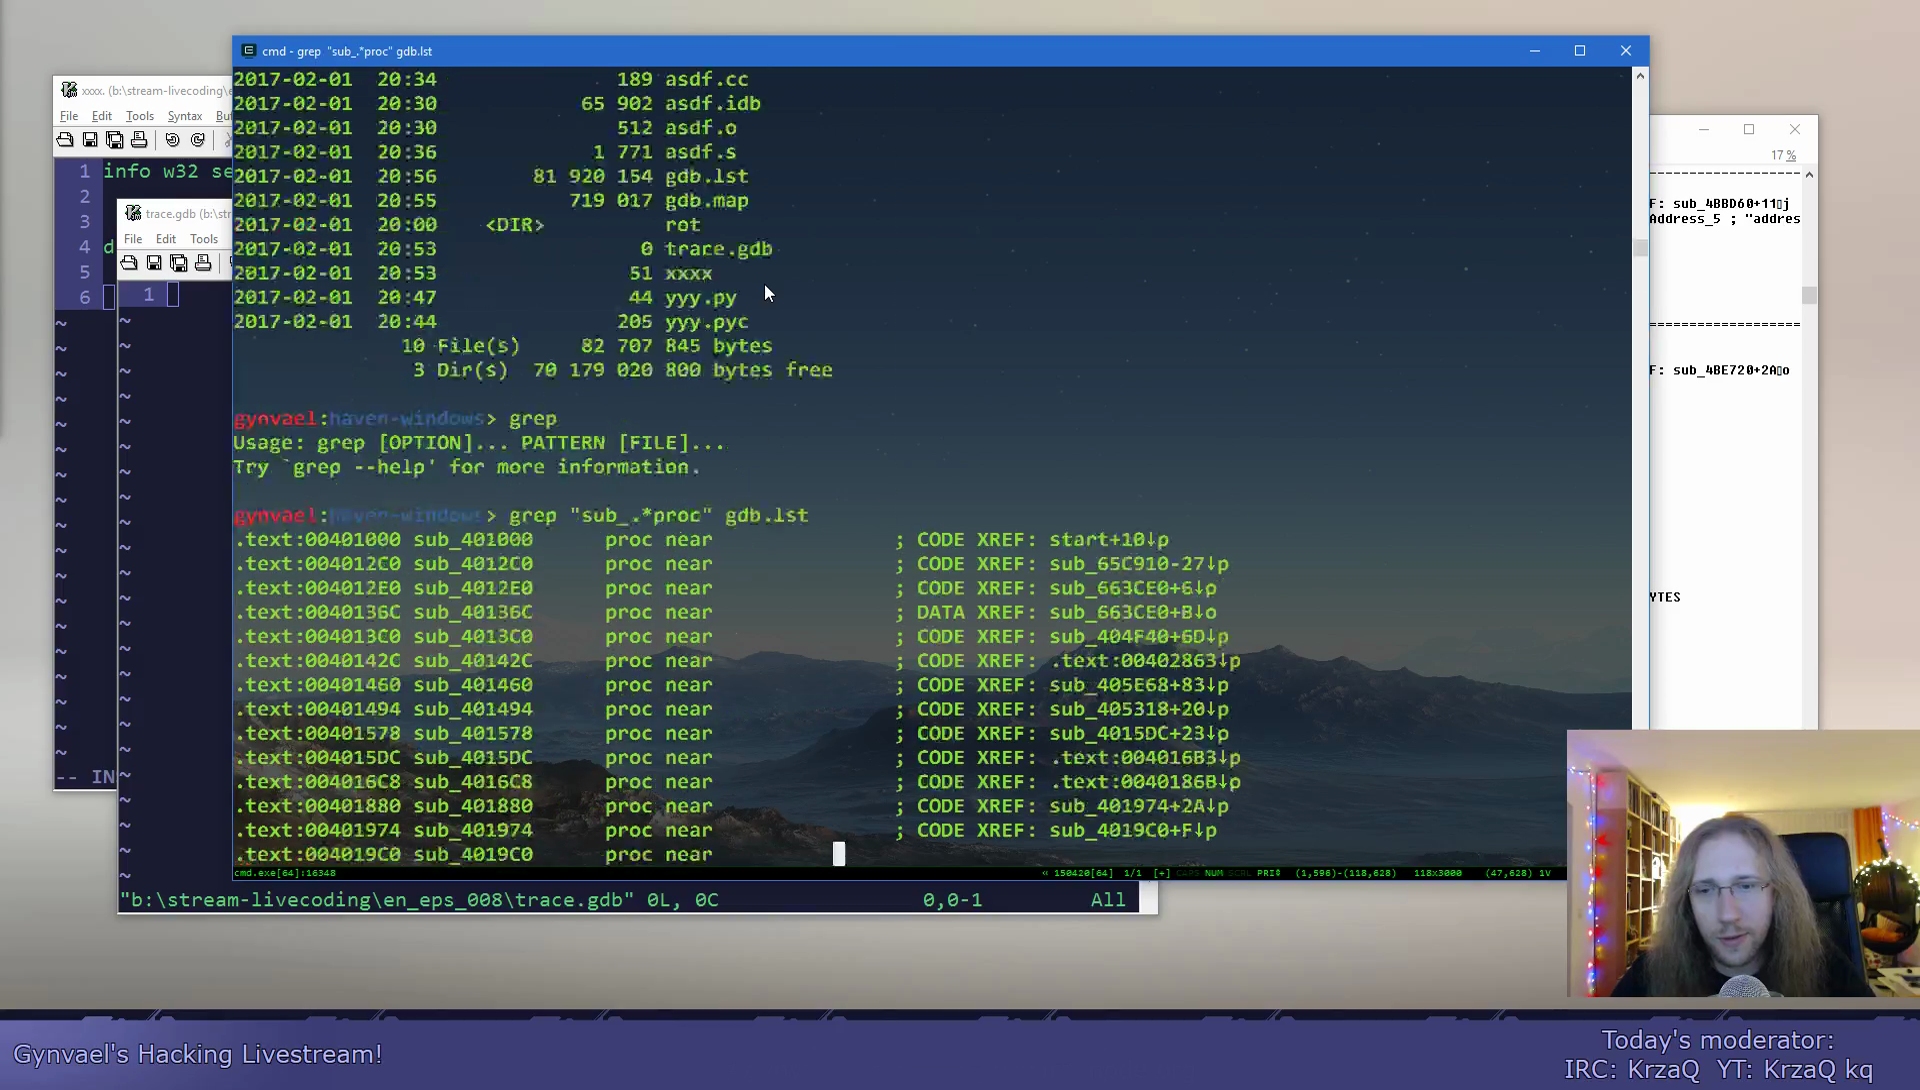
2. I've grepped for all the functions IDA found.
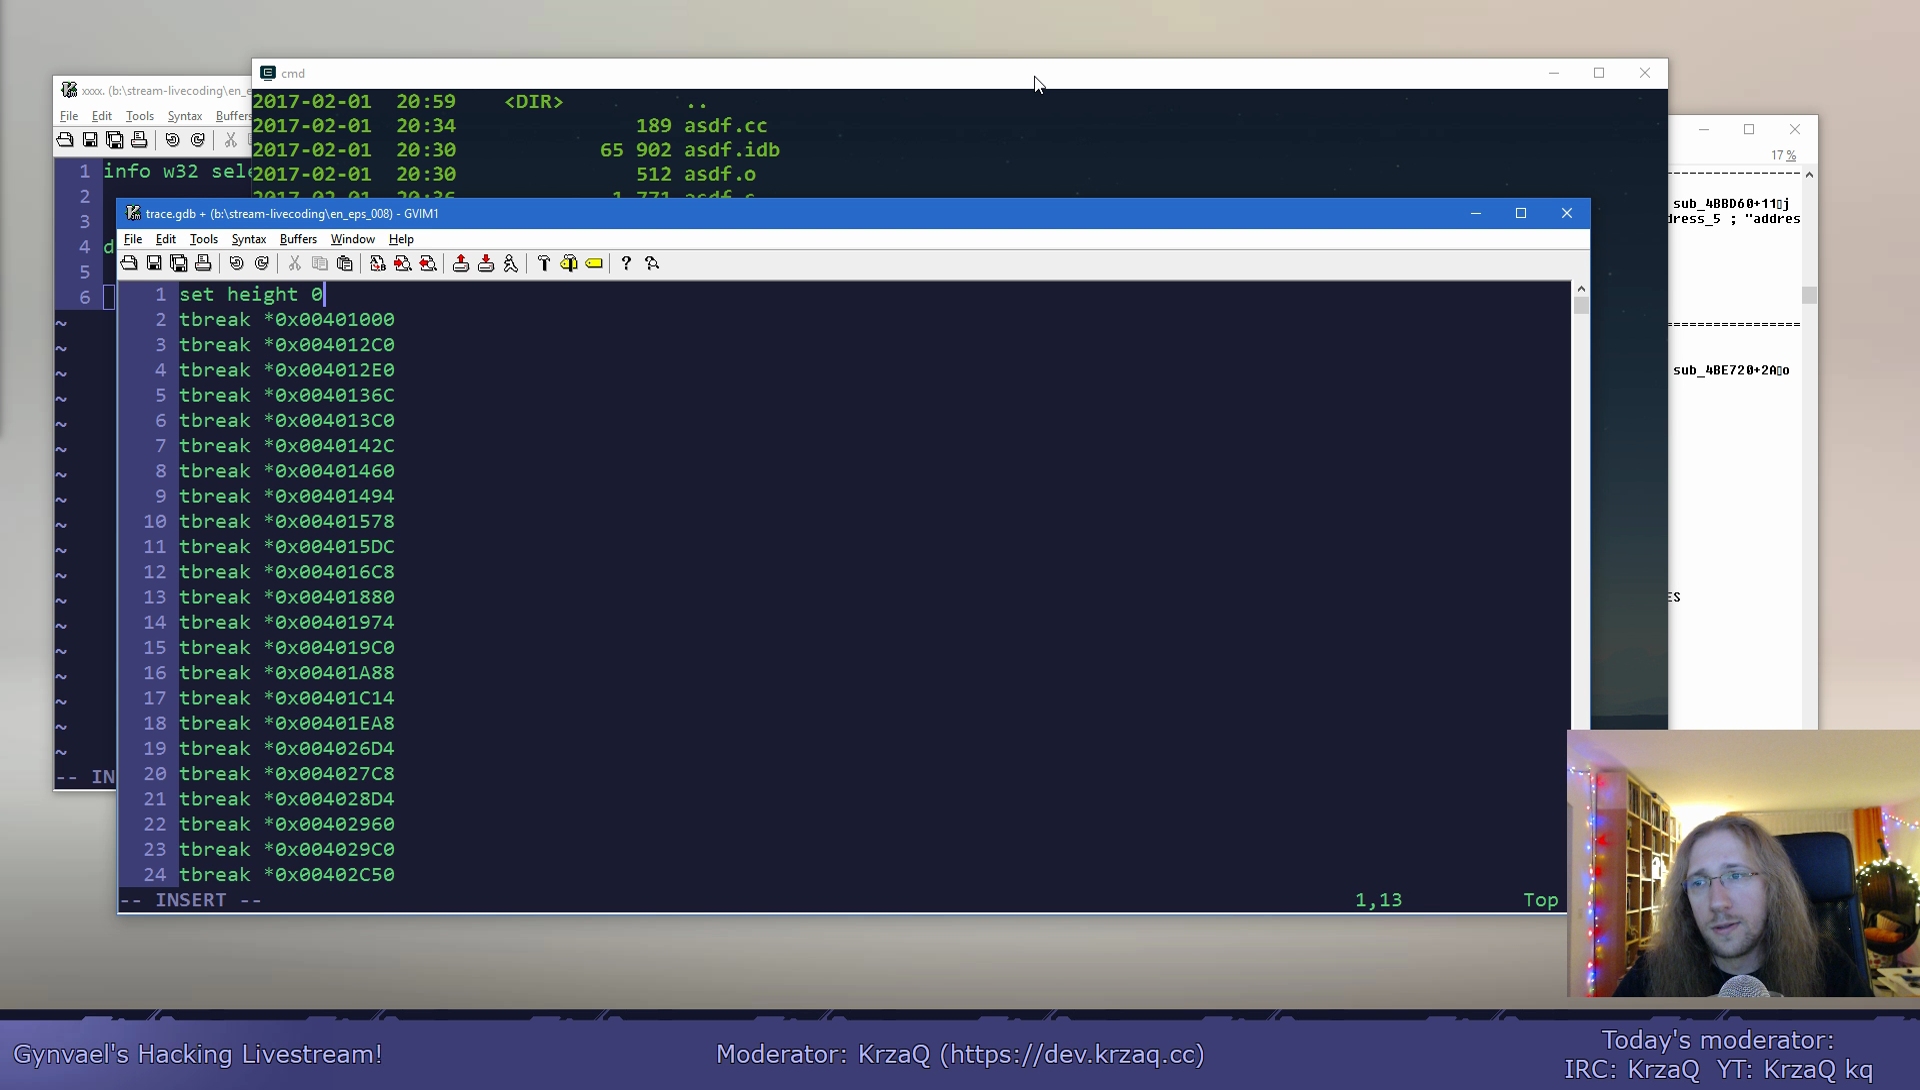
3. And converted the addresses to a GDB script that set temporary breakpoints (tbreak).
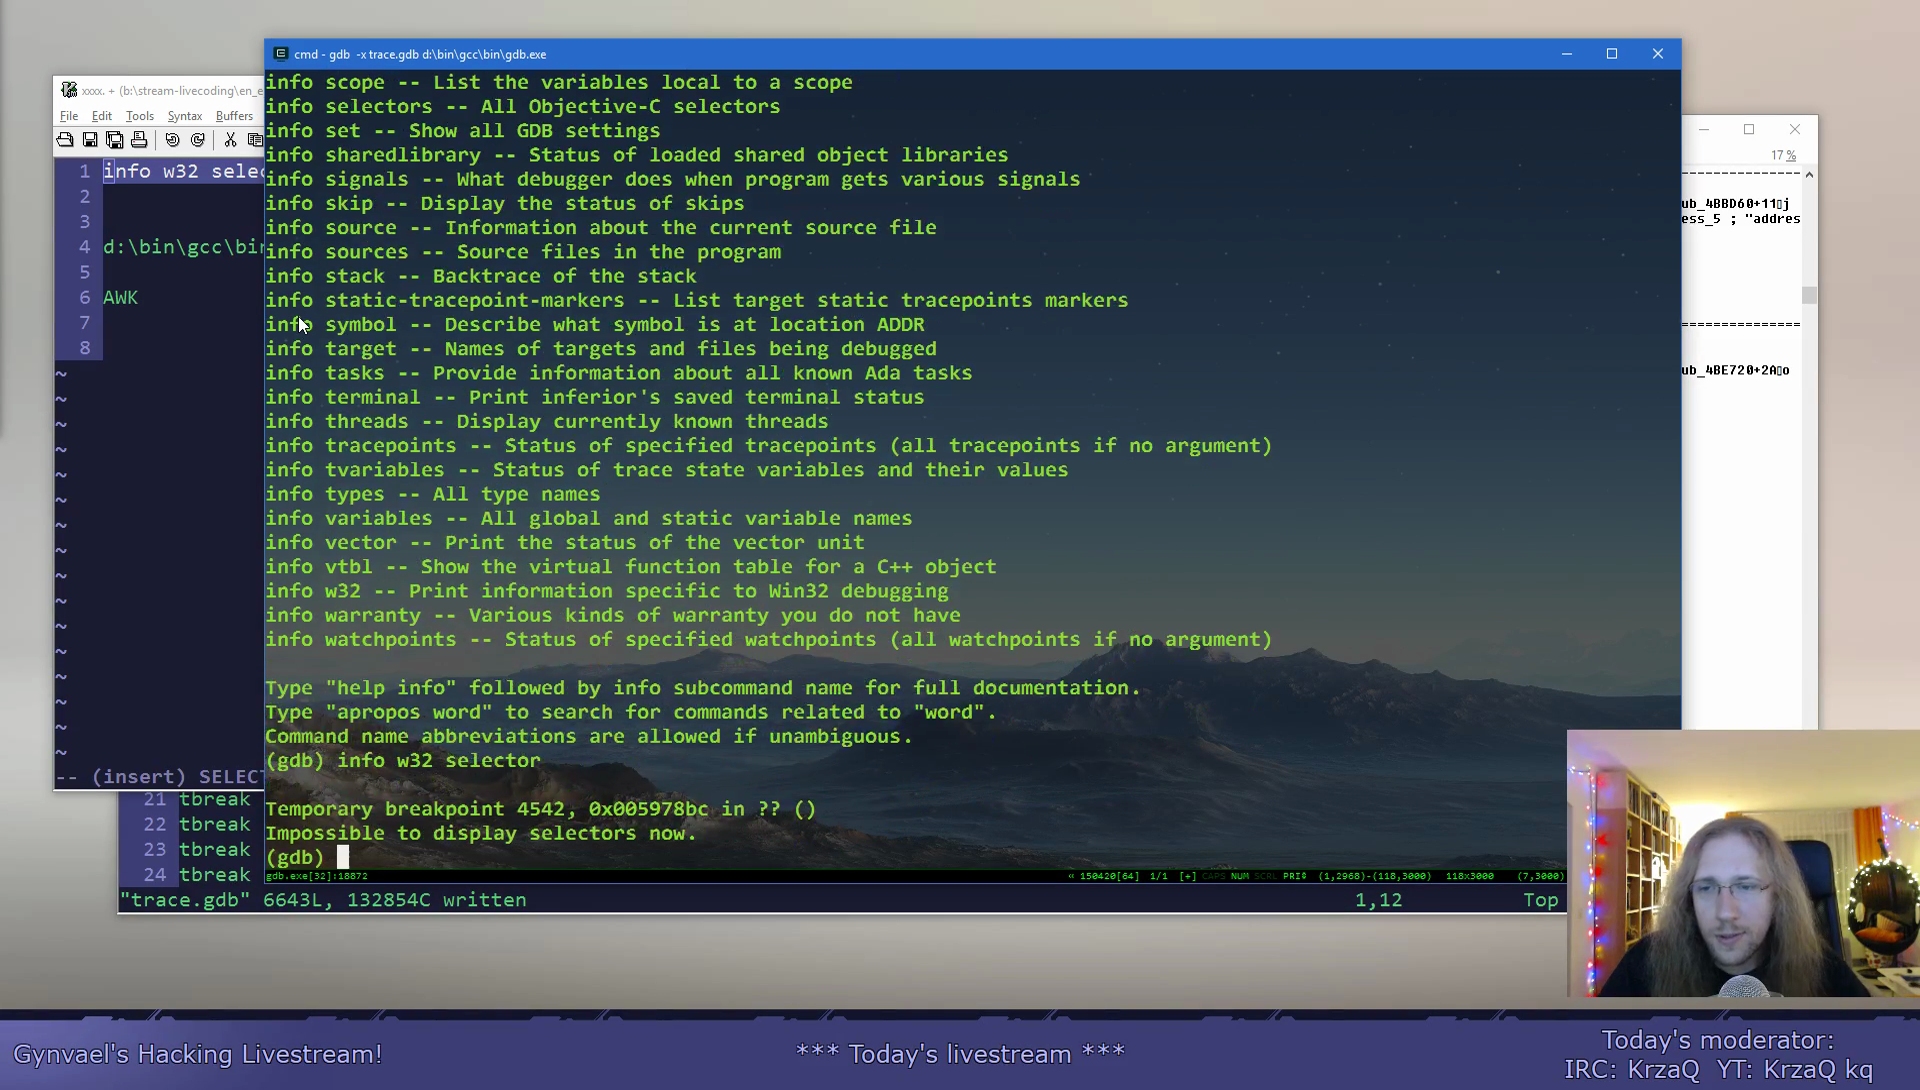
4. Then I run GDB in GDB, executed some commands and waited for all possible temporary breakpoints to hit (and become disabled). After that, I've executed the command which's implementation I was looking for (info w32 selector) and only one tbreak executed - 0x005978bc.
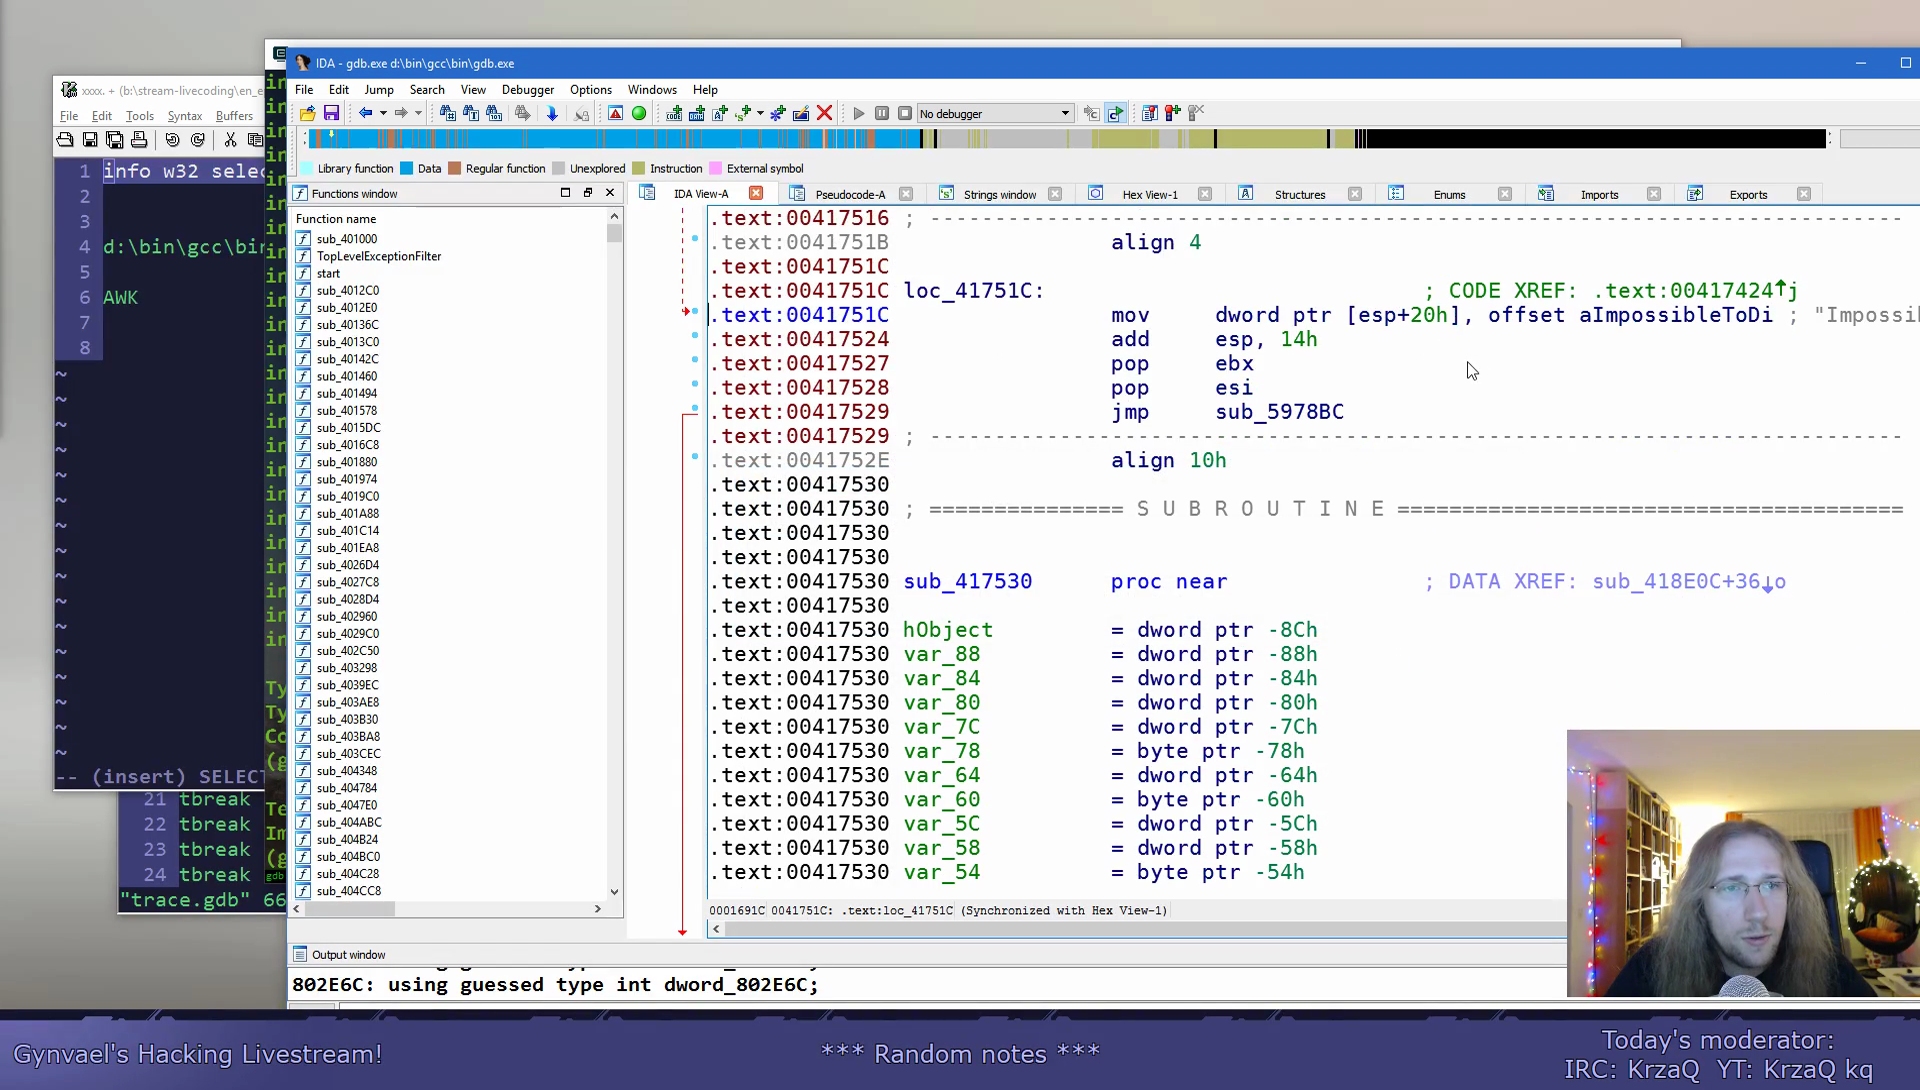
5. Using the known related string backtracking method I found the implementation at a totally different address - 0x0041751c. Oops.
So what did I do wrong? The answer is actually on the last screenshot. Let's zoom it in:
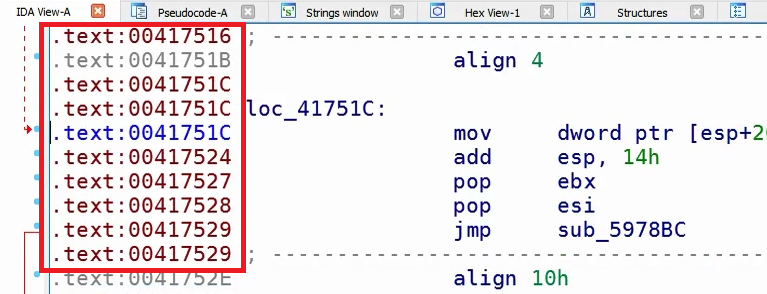
As one can observe, the addresses are dark red (or is it brown?), which means that IDA didn't recognize this part of code as a function. That in turns means that a breakpoint for this function is actually not on the list of temporary breakpoints, so there was never any chance for it to show up.
How to correct the problem? There are two ways:
1. If using this exact method, make sure that all the functions are actually marked as such in IDA before generating the tbreak list.
2. Or just use a different tracing method - e.g. branch tracing or another method offered by the CPU.
I've re-tested this after the stream adding the missing function breakpoint, and guess what, it worked:
(gdb) info w32 selector

Temporary breakpoint 1, 0x00417414 in ?? ()

Temporary breakpoint 4544, 0x005978bc in ?? ()
Impossible to display selectors now.
(gdb)
And that solves yesterday's the mystery :)
Comments:
Thanks Gynvael!
Add a comment: