


Note 1: While I'll write down a short recap of the initial steps and discoveries, please take a look at the recording of the episode #10 for details (crackme starts at 15m40s). If you've already seen it, just jump to part 2 in the second half of this post.
Note 2: Since this post is meant to have some education value I'll assume that the readers have only basic knowledge on RE techniques, and therefore I'll try to be verbose on some topics which are most likely well known amongst the more senior folks.
Part 1: Recap
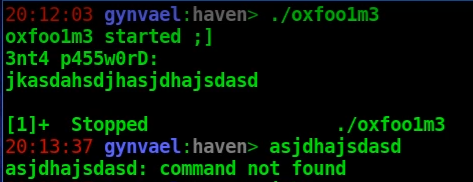
Initial recon (i.e. reconnaissance phase) consisted of a couple of rather simple steps:- Obvious things first: just running the binary and seeing how it behaves. Surprisingly we could already derive the possible password length just by looking what was left in the standard input buffer after the crackme stopped (compare the input string to the "asjdhajsdasd" letters seen as the next commands).
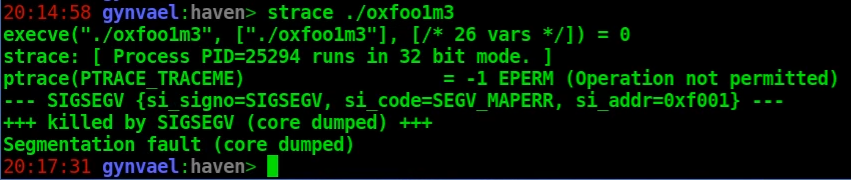
- Running the binary via strace - this actually didn't go too well due to ptrace(PTRACE_TRACEME) protection.
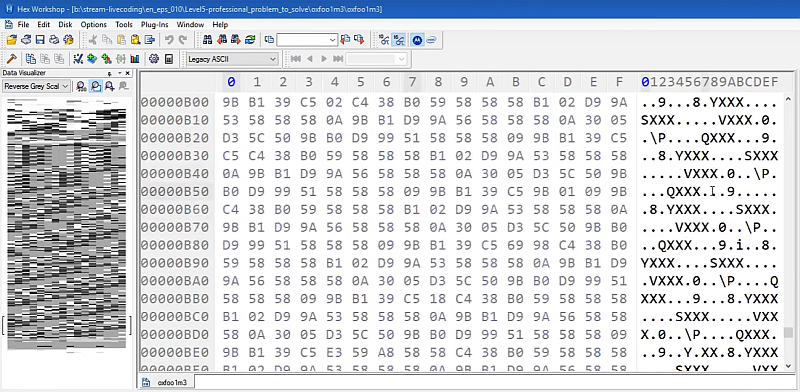
- Viewing the file in a hex editor - showed quite a lot of "X" characters.
- Checking the entropy level chart (though at this point it was already known it will be low, as per the hexeditor inspection). You can read more about this entropy-based recon technique in this post from 2009.

- And finally loading the binary into IDA / Binary Ninja.
Up to this moment we already learned that it's a rather small crackme with no non-trivial encryption (though the entropy test did not rule out trivial encryption - i.e. substitution ciphers like single-byte-key XORs, etc - and such was indeed encountered later on) that actively tries to make debugging and reverse-engineering harder. Not much, but it does give one a broad picture and it usually takes a few minutes tops, which makes it worth it.
PTRACE_TRACEME trick
We've also found the first anti-debugging trick, which was the aforementioned ptrace(PTRACE_TRACEME) call.The idea behind it is related to the fact that a process can be debugged (ptrace() is the debugging interface on Linux) at most by one debugging process at a time. By calling ptrace(PTRACE_TRACEME) the callee process tells the kernel that it wants to be debugged by its parent (i.e. that its parent process should be notified of all debugger-related events). This call will result in one of two outcomes:
- The call succeeds and the parent process becomes the debugger for this process (whether it wants it or not). The consequence of this is that no other debugger can attach to this process after this call.
- The call fails, ptrace(PTRACE_TRACEME) returns -1 and errno is set to EPERM (i.e. "operation not permitted" error). This happens only* if another debugger is already tracing this process, which means this can be used to detect that someone/something is debugging this process and act accordingly (e.g. exit the process complaining that a debugger is present or misbehave in weird ways).
* - This isn't entirely true; it can also fail if the callee process is created from a SUID binary owned by root and was executed by a non-root user.
So the anti-RE-engineer wins regardless of what ptrace returned.
The usual way to go around this is to find the ptrace(PTRACE_TRACEME) call and NOP it out, though in the past (uhm, during a competition in 2006) I remember doing an ad-hoc kernel module which would fake this function for chosen processes.
Another way is to catch the syscall with a debugger and fake the return value, however in our case this turned out to not be possible since the ELF file was modified in a way that prevented loading it in GDB:
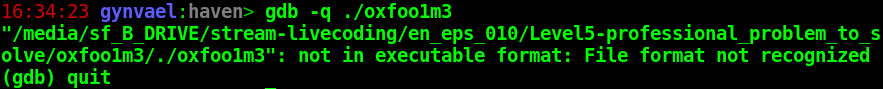
I'll get back to bypassing the anti-GDB trick in part 2 down below.
Simple assembly obfuscation schema
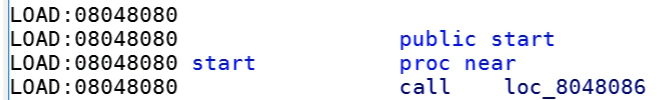
Analyzing the binary in IDA quickly led to the discovery of a simple yet moderately annoying obfuscation schema: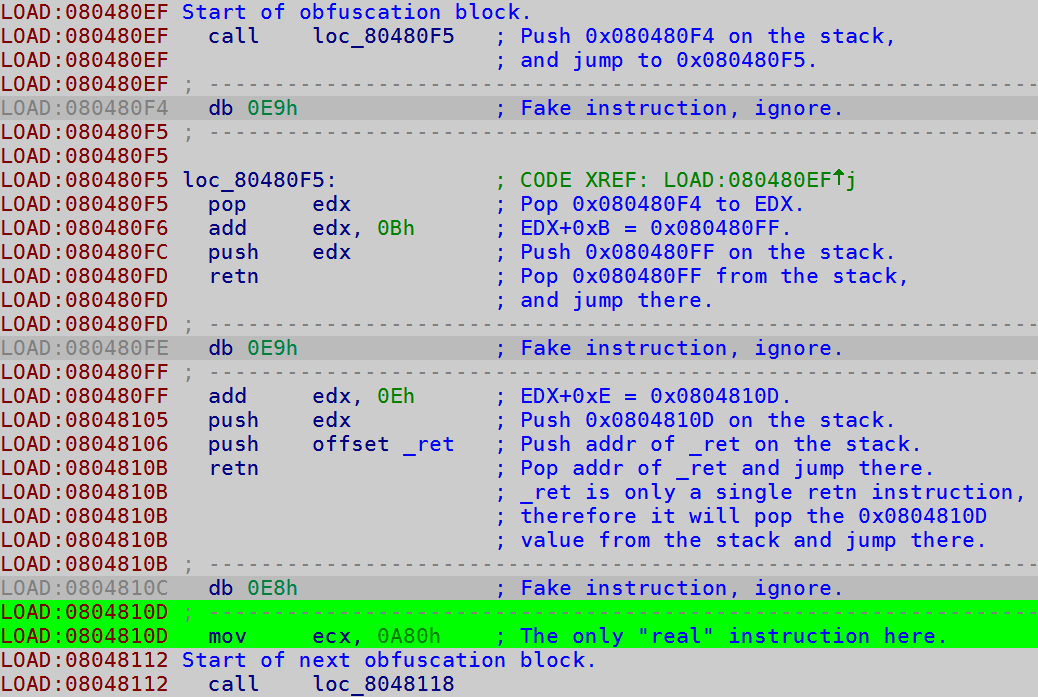
As one can see in screenshot above, between each "real" instruction there is a 30-byte block which basically jumps around and does quite a lot of nothing. The sole purpose of that is making the assembly dead-listing (i.e. the output of a disassembler) less readable.
There are several ways to mitigate this kind of protections:
- One is to simply ignore it, as I did on the livestream. I figured that since it consists only of 30 byte blocks I can just manually make sure all the "real" instructions are disassembled correctly, and then I can skip the non-meaningful ones.
- Another idea would be to write a simple script which just changes these instructions to NOPs - this would be pretty easy as it seems the whole block consists always of the same bytes (i.e. the call's argument is relative - therefore constant, the offset to _ret is constant, and everything else also uses always the same immediate values, instructions and registers). This simplifies the dead-listing analysis as only the meaningful instructions are left in the end.
- Yet another way - tracing + simple filtering - is shown in the second half of this post.
Trivial encryption layer
After finding all of the "real" instructions (there was only a handful of them) it turned out that the code is doing in-memory decryption of another area of the code before jumping there:LOAD:080480C2 mov esi, offset loc_8048196
LOAD:080480CE mov edi, esi
LOAD:080480EE cld
LOAD:0804810D mov ecx, 0A80h
LOAD:08048135 lodsb
LOAD:08048154 xor al, 0x58; 'X'
LOAD:08048174 stosb
LOAD:08048193 loop loc_8048135
The decryption is actually just XORing with a single-byte key - letter 'X', or 0x58 - which explains both why the entropy was low (as mentioned before, certain types of ciphers - which I personally call "trivial ciphers", though it's not really a correct name - don't increase the entropy of the data; XOR with a single key falls into this category) and why we saw so many X'es in the hex editor (it's common for a binary to have a lot of nul bytes all around, and 0^0x58 gives just 0x58).
Again, there are several ways to go about it:
- First one, which I've learned during the livestream from one viewers [uhm, I'm sorry, I don't remember your name; let me know and I'll put it here], is using the XOR decrypt function in Binary Ninja (if you're using this interactive disassembler): in hex view select the bytes, then right-click and select Transform → XOR → 0x58 as key.
- Second would be doing a similar thing in IDA - as far as I know this would require a short Python/IDA script though.
- And yet another method, which I usually prefer is writing a short Python script that takes the input file, deciphers the proper area and saves it as a new file.
The reason I personally prefer the last method is that it's easy to re-run the patching process with all kind of changes (e.g. switching up manual software breakpoints, commenting out parts of the patches, etc).
In any case, the initial script looked like this (Python 2.7):
# Read original file.
d = bytearray(open("oxfoo1m3", "rb").read())

OFFSET = 0x196  # Offset in the file of encrypted code.
LENGTH = 0xA80  # Length of encrypted code.

# Decipher.
k = bytearray(map(lambda x: chr(x ^ 0x58), d[OFFSET:OFFSET+LENGTH]))
d = d[:OFFSET] + k + d[OFFSET+LENGTH:]

# Change XOR key to 0 (i.e. a XOR no-op).
d[0x154 + 1] = 0

# Write new file.
open("deobfuscated", "wb").write(str(d))
Executing the script yielded in a deciphered executable and the analysis could continue.
The end of the livestream
The last thing I did during the livestream was to look around the code and finally to try to figure out where is that PTRACE_TRACEME protection executed from (so I could no-op it). I tried to do this by injecting the CC byte (which translates to int3, i.e. the software breakpoint; it's also one of the very few x86 opcodes that are worth to remember) at a few spots that looked interesting (one of them was an "int 0" instruction), then run the modified version and analyze the core file it generates (i.e. the structured memory state which is dumped when a process is killed due to certain errors on Linux; courtesy of ulimit -c unlimited setting in Bash, amongst other things). This resulted in a weird crash where EIP was set to 0xf001 (which happens to be crackme author's nickname), what made me think there is some kind of a checksum mechanism in play (turned out to be close, but not accurate).And at think point the livestream has ended.
Part 2: End game
A few days after the livestream I found some time to get back to the challenge. I decided to continue with a different approach - one of using instruction-grained tracing. But before I could do that I had to deal with a problem of not being able to run the challenge under a debugger (due to the ELF file being modified in a way which GDB disliked).The method I would use in an environment that has a JIT debugger (i.e. Just-In-Time debugger - a registered application which starts debugging an application when it crashes; it's a Windows thing) would be inserting z CC at program's entry point. This would make the crackme crash at the first instruction and automatically attach the debugger - pretty handy.
On Ubuntu however I had to insert an infinite loop instead (a method also suggested by one of my viewers), i.e. bytes EB FE - another opcode worth writing down and remembering. This was done by adding the following line to my Python patching script:
d[0x80:0x82] = [0xeb, 0xfe]  # jmp $
                              # original bytes: e8 01
                              # set *(short*)0x08048080=0x01e8
Thanks to this approach, after executing the crackme it basically "hangs" (it's technically running, but always the same infinite-loop instruction) there is time to calmly find the PID of the process, attach the debugger, replace the EB FE bytes with the original ones and start the trace.
As previously, I like to do this with a script (this time a GDB script):
set *(short*)0x08048080=0x01e8
set disassembly-flavor intel
set height 0

break *0x8048195
c

# Most basic form of tracing possible.
set logging file log.txt
set logging on
while 1
  x/1i $eip
  si
end
The script above can be executed using the following command:
gdb --pid `pgrep deobfuscated` -x script.gdb
The result is a log.txt file containing a runtime trace of all executed instructions from 0x8048195 up until the application crashes.
0x08048195 in ?? ()
=> 0x8048195:	ret
0x0804809e in ?? ()
=> 0x804809e:	call   0x80480a4
0x080480a4 in ?? ()
=> 0x80480a4:	pop    edx
0x080480a5 in ?? ()
=> 0x80480a5:	add    edx,0xb
0x080480ab in ?? ()
=> 0x80480ab:	push   edx
0x080480ac in ?? ()
=> 0x80480ac:	ret
0x080480ae in ?? ()
...
The first thing to do was to filter out the log, i.e. remove all lines containing obfuscation instructions, as well as instructions that don't contain any instructions at all (e.g. "0x080480ac in ?? ()"). This can be done with a simple set of regex in your favorite text editor. In my case (gvim) it boiled down to:
%g/^0x/d
%g/push/d
%g/pop/d
%g/call/d
%g/add\tedx,0xb/d
%g/add\s\+edx,0xb/d
%g/add\s\+edx,0xe/d
%g/add\s\+ecx,0x9/d
%g/ret/d
Please note that the above approach is pretty aggressive in the sense that it might remove actual meaningful instructions; but in the end that didn't matter in this case (in other cases it might though, so keep this in mind).
This resulted in a rather short assembly snippet (I've added a few comments):
=> 0x804869c:	xor    eax,eax
=> 0x80486c9:	xor    ebx,ebx            ; EBX=0 (PTRACE_TRACEME)
=> 0x80486f6:	mov    ecx,ebx
=> 0x80486f8:	inc    ecx
=> 0x80486f9:	mov    edx,ebx
=> 0x8048726:	mov    esi,eax
=> 0x8048753:	add    eax,0xd
=> 0x8048783:	shl    eax,1              ; EAX=26 (ptrace)
=> 0x80488b2:	mov    edx,0x8048a4e      ; Address of int →0← argument.
=> 0x80488e2:	mov    ch,BYTE PTR [edx]  ; Grabbing the argument byte.
=> 0x804890f:	mov    cl,0x10
=> 0x804893c:	shl    cl,0x3             ; CL = 0x80
=> 0x804896a:	mov    BYTE PTR [edx],cl  ; It's now int →0x80←.
=> 0x8048997:	xor    ch,cl              ; Checking if the old argument
                                         ; was not 0x80.
=> 0x80489c4:	je     0x8048653          ; If it was, go crash.
=> 0x8048a4d:	int    0x80               ; Call to ptrace()
=> 0x8048aa7:	mov    edx,0x8048a4e
=> 0x8048ad7:	mov    BYTE PTR [edx],cl
=> 0x8048826:	or     al,al              ; Check if ptrace() failed.
=> 0x8048853:	jne    0x8048653          ; It did, go crash.
=> 0xf001:	go.gdb:10: Error in sourced command file:
Cannot access memory at address 0xf001
Detaching from program: , process 30843
Analyzing the above code shows that the int 0 instruction discovered earlier has its argument replaced by 0x80 (Linux system call interface), but also there is a check that checks if the argument wasn't already 0x80 (it's probably this that I mistakenly assumed would be a checksum mechanism; keyword: probably, as I'm having some doubts whether I actually triggered this). After that, at 0x8048a4d ptrace(PTRACE_TRACEME) is called and the return value is checked; if it's non-zero, the 0x8048653 branch is taken and the crackme crashes (note that since this is the filtered trace, we don't see the actual instructions that cause the crash; but it's basically push 0xf001 + ret).
To mitigate this protection is enough to NOP out (i.e. replace with byte 0x90 - the no-operation instruction) the jump at 0x8048853. To do this I've added the following line to my Python patching script:
# nop-out ptrace check
d[0x853:0x859] = [0x90] * 6
Once this was done and the executable was regenerated, I've run the tracing again and filtered it with the aforementioned regex. This resulted in a not much larger listing and another crash, but the content itself was really interesting and strongly hinted at the solution:
=> 0x804832d:	mov    edx,0xb
=> 0x804835d:	int    0x80
=> 0x80483e2:	mov    esi,0x8048223    ; Input address.
=> 0x8048412:	mov    edi,0x8048223
=> 0x8048442:	mov    ecx,0xb
=> 0x8048472:	lods   al,BYTE PTR ds:[esi]
=> 0x804849e:	xor    al,dl
=> 0x80484cb:	inc    dl
=> 0x8048524:	neg    ecx
=> 0x8048551:	add    ecx,0x8048239     ; String "myne{xtvfw~".
=> 0x8048582:	cmp    al,BYTE PTR [ecx]
=> 0x8048584:	je     0x80485a4
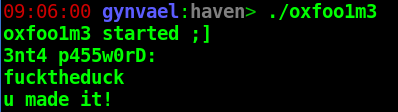
The code above basically fetches one byte of input, XORs it with 0xB (which is then increased to 0xC, 0xD, and so on), and compares with one byte of the weird "myne{xtvfw~" string. This means that to get the password one needs to XOR the weird string with 0xB+index:
>>>''.join([chr(ord(x) ^ (i+0xb)) for i, x in enumerate(m)])
'fucktheduck'
This resulted in another weird string, which, guess what, this indeed was the solution :)
To sum up, what I really liked about this crackme was that it used multiple protections, but all of them were pretty simple and didn't overdo it - this makes it a great challenge for early intermediate reverse-engineers to practice their skills.
Comments:
It was fun! :)
Thank you for the 0xCC trick at EP for JIT-debugging, really useful.
Cheers!
1) Your GDB script writes "jmp $" at the entrypoint and then you start single stepping with logging EIP.
My question is where (or how) do you break from "jmp $" ? where do you restored the original bytes ? I've missed this part.
2) when you execute the GDB script to attach "gdb --pid `pgrep deobfuscated` -x script.gdb" isn't it too late to attach since the program is already running ?
Glad you liked it :)
@Donald
Sorry, I might have not been clear on that one. The EB FE (i.e. infinite loop) is patched in by the Python script that I also use for decrypting the binary. So the EB FE bytes are already in the "deobfuscated" binary I execute.
Therefore once I run it, it just hangs on EB FE and then I attach the debugger.
The "set *(short*)0x08048080=0x01e8" instruction in GDB script is actually restoring the original bytes that I did overwrite with EB FE when "generating" the binary file.
Let me know if this clears it up.
True :) There are various methods to do it. E.g. new CPUs have really cool features to do it.
An awesome list is in this presentation by Robert Święcki (in Polish though, but keywords are there):
http://www.instytutpwn.pl/wp-content/uploads/2016/11/%C5%9Aledzenie-%C5%9Bcie%C5%BCki-wykonania-procesu-dla-security-researchera-i-programisty-ROBERT-%C5%9AWI%C4%98CKI.pdf
Haha well spotted :)
Add a comment: