 Todays post won't be about cmd.exe and BAT, for the moment, I have exhausted that topic. Instead, I'll write about drawing cool-looking "pictures" using sin and cos functions, in C++.
As always, the story begins 100 years ago, when in a popular (in that times) polish computer (8-bit!) magazine (called "Bajtek") I've read an article about making cool-looking "pictures" (almost like precision ;D) on the screen, using the above math functions. The pictures were really cool (their rendering was "animated" - it was so slow, that one could see the lines actually being drawn), and looked 'scientific' ;D
A hundred years have passed, and I decided to dig out that topic once again (reading my blog one may think that I am over 100 years old, and that computers were popularized in the 19th century; please, do NOT use the history dates or periods found on my blog when passing some history exams :D). I've created a program, that calls sin and cos in a loop (two times even!), and places a pixel in the calculated place (a green pixel of course). The whole program can be describer using the following pseudo-code:
for(i = 0; i < iter; i++)
  {
    rt += ratio;
    x += sin(rt*A) * cos(rt*C);
    y += sin(rt*E) * cos(rt*G);
    putpixel(x, y, HACKISH_GREEN);
  }
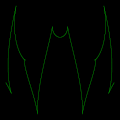
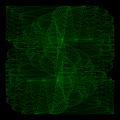
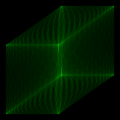
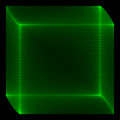
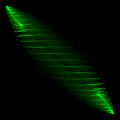
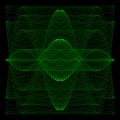
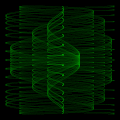
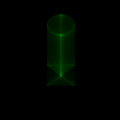
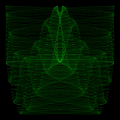
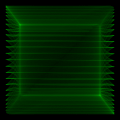
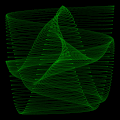
It occurs, that changing the coefficients A E C and G, one may get veeery interesting results - a cube, the batman logo, etc - checkout the gallery on the bottom of this post.
As always, the source+binary can be downloaded on the bottom. And now, a short users manual - we use the keyboard to control this, there is no graphical interface (except for the image being displayed), and some outputed text information is show on stdout (aka console). The keyboard shortcuts are listed below:
Q - increase the A coefficient by delta
A - decrease the A coefficient by delta
W - increase the C coefficient by delta
S - decrease the C coefficient by delta
E - increase the E coefficient by delta
D - decrease the E coefficient by delta
R - increase the G coefficient by delta
F - decrease the G coefficient by delta
3 - increasing the delta 10 times
4 - decreasing the delta 10 times
5 - increasing the angle-change speed (ratio in pseudo code)
6 - decreasing the angle-change speed
0 - refresh
9 - 'fit to window'
strzałki - move the image
Z - zoom more on X
X - zoom less on X
C - zoom more on Y
V - zoom less on Y
B - increasing the number of iterations by 1kk
N - decreasing the number of iterations by 1kk
1 - zwiększenie intensywności kolorów
2 - zmniejszenie intensywności kolorów
M - make a screenshot and save it to a RAW file (RGB 1024x1024) + saving the coefficients in "fajne.txt" file (time to learn Polish! fajne == cool)
And thats it. I'll add that the binary executable uses 1024x1024 image. The code was coded for Windows, sorry. Maybe I'll port it later to SDL.
By the way...
If want to improve your binary file and protocol skills, check out the workshop I'll be running between April and June → Mastering Binary Files and Protocols: The Complete Journey
sincos.zip (22kb)





Comments:
Could you also publish the coefficient values for the patterns you generated, especially the Batman logo?
Add a comment: