As one can figure out from the tags of this post, the knowledge of entropy distribution can be useful while reverse engineering some application. To be more precise, measuring entropy is done in the reconnaissance phase of analysis, and it allows one to learn about which parts of the application is encrypted/compressed, where are the blank spaces, which parts are not compressed, where are the strings/texts, bitmaps, etc.
Let's start at the beginning - what exactly is entropy (in the IT meaning)? Personally, I favor an unofficial definition, that states that entropy is the measure of chaos, meaning, that the more chaotic/random the data is - the higher their entropy is, and the more monotonous/constant/ordered/non-random the data is - their entropy is lower. So we've learned two things: (1) entropy is the measure of randomness of (2) some provided data. In our (RE) case, we can says that the 'provided data' are the succeeding bytes of some file / memory region / network packet / etc. In case of the Ent tool, one-pixel bar on the chart shows the entropy of 256 succeeding bytes of data (the file is split to N 256-bytes regions, and the entropy of each region is calculated and shown as a one-pixel bar on the chart).
How to calculate the entropy? There are a few methods. I use a simplified one (it doesn't catch all the correlations) that works by analyzing the histogram (array of frequency of occurrence of each value of byte - i.e. one can learn from a histogram that 'A' occurs 100 times, 'B' 50 times, etc) of the data. For each entry in the histogram, it calculates Entropy += Occurrence_Number[X]^2 / Data_Size, where X are the succeeding values of byte (from 00 to FF) (at the end we can divide the entropy by the size of data (in bytes), and invert it (X = 1-X), it's not needed, but I do it anyway). Another good idea is to calculate Entropy^2, then the entropy differences are more noticeable - I'll use E" as Entropy^2 from now.
For example, let's take the following 50-byte data, and let's calculate it's entropy, step by step:
ABCABCCABCABACBABABABABABABCABACBACBABABACBABACBAB
First, the histogram (what - how many):
A - 20
B - 20
C - 10
other - 0
Now the entropy (E):
E = 0                (    E = 0   )
E += 20 * 20 / 50    ('A' E = 8   )
E += 20 * 20 / 50    ('B' E = 16  )
E += 10 * 10 / 50    ('C' E = 18  )
E = 1 - (E / 50)     (    E = 0.64)
E" = E^2             ( E" = 0.4096)
So the final E of this fragment is 0.64 (or 64%), and the E" is 40,96%.
From this moment I'll use the E" value only, and I will refer to it just as "entropy".
But what exactly "40% entropy" means? Let's calculate E" for two more fragments of data, so one can discriminate what is what (just the results this time):
AAAAAAAAAAAAAAAAAAAAAAAAAAAAAAAAAAAAAAAAAAAAAAAAAA - E" = 0.00%
ABCDEFGHIJKLMNOPQRSTUVWXYZabcdefghijklmnopqrstuvwx - E" = 96.04%
As one can see, the "constant" stream of A letter has zero entropy, but the stream of letters, where each letter is different and occurs only once, has entropy 96.04%.
(OK, why 96.04% and not 100%? It's because of my simplified formula - the bigger the size of data is, the closer it gets to 100%. The maximum value of the entropy in case of my formula will be (1 - (1 / Size Of Data)), so if one wants the scale from 0 to 100%, one should additionally multiply E by 1 / (1 - 1 / Size Of Data), but it's not that important anyway.)
Now we know how to calculate the entropy. But what does that give us? It happens so that different "types" of data have different entropy - so if we have a bundle of different types of data (like in an executable file), one can use entropy chart to learn what data types lay where in the file. There are a few regularities I was able to observe (for a 256 byte data piece):
1) Data/code encrypted with a "non-trivial" cipher (I'll talk about what a "non-trivial" cipher is later in this post) have E" >= 97%
2) Compressed data/code has E" >= 97%
3) "Empty" place (i.e. zeroed) has E" == 0%
4) Identical data in a few succeeding data fragments has constant E"
5) x86 code has 80% <= E" <= 95%
6) Text data has 18% <= E" <= 90%
7) Headers have usually a very low E" (since they consist of many zeros), usually on the 50% level
8) Random data has very high entropy, E" >= 97%
9) Cipher keys have usually very high entropy, E" >= 97%
10) Arrays of constants for algorithms like AES or MD5 have very high entropy (this depends however on the implementation and used compiler), usually E" >= 92%
A little explanation on what the "non-trivial" cipher is (in this case). I'll explain it by contrast - a "trivial" cipher in this case is a cipher that doesn't change the entropy of data/code, meaning that the sorted values of a histogram of initial and encrypted data is identical (meaning, if the chart that occurred the most times in initial data, occurred 100 times, than the char that occurs in the encrypted data will occur also 100 times, even if it's a different char; and the same for the send-most-occurring char and so on). Examples of such "trivial" ciphers are:
1) Adding a one-byte CONSTANT to each byte
2) Subtracting a one-byte CONSTANT to each byte
3) XORing a one-byte CONSTANT with each byte
4) Binary rotation of each byte, left or right, a CONSTANT number of times (bits)
5) Other switching the places of bits in a byte using a CONSTANT schema
6) Other reversible operation on each byte, identical to each byte
7) Compositions of above
"Trivial" ciphers do not change the entropy of the data in case of the formula I use, however, every other cipher WILL IN FACT CHANGE the entropy, usually raising it (except some ultra strange accidents with XORing data with identical-to-data key, resulting in a zero-stream with null entropy). Some examples of ciphers changing entropy:
1) Adding position of a byte to that exact byte (data[i] += i)
2) XORing data with a long non-null-entropy key
3) AES, RC4, etc
In case of anti-RE, sometimes it's better to use a "trivial" cipher, since the power of cipher makes no difference anyway (since the key has to be included), but more powerful ciphers give away the position of encrypted data.
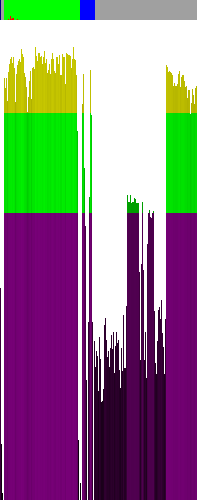
Time for a gallery of entropy charts (made by Ent), with my comment for each. A small remark before I'll start - if we want to know where in the file a single entropy bar lays, then we just take the position of that bar (X axis) and multiply it by 256 - i.e. a bar is at X=83, so the data in the file are at HEX(83*256) = 5300h.

The above charts shows the entropy of a compiled by MinGW GCC, not stripped, version of Ent executable. A few observations:
1) No part of the file is encrypted by a non-trivial cipher
2) There are headers at the very beginning of the file, followed by 256 bytes of zeros, or some other constant bytes (look at the first 4 bars)
3) In the code section (marked green on top) lays, in fact, the code ;>
4) In the data section (blue on the top) many zeros lay, and there are two "fragments" of data, maybe it's text (5300h and 5A00h)
5) In the "gray" area there are some headers (low entropy in the center of the image) - headers/information for a debugger?
6) In the "gray" area, from 125 to 152 column, there is a risen entropy area, some more information for the debugger?
7) On the right side of the screen the entropy is high, but it is not code (what would it be doing there?), so probably it's some text data (and in fact it is, these are the names of symbols)

The same file, packed with UPX. A few observations:
1) The code sections is either encrypted or compressed (in case of RE is barely makes a difference)
2) At the end of the section (2-3 last bars) some not-encrypted code exist (in fact it's the decompressing loader)
3) As for the rest, same as in the case of not-packed version of the file

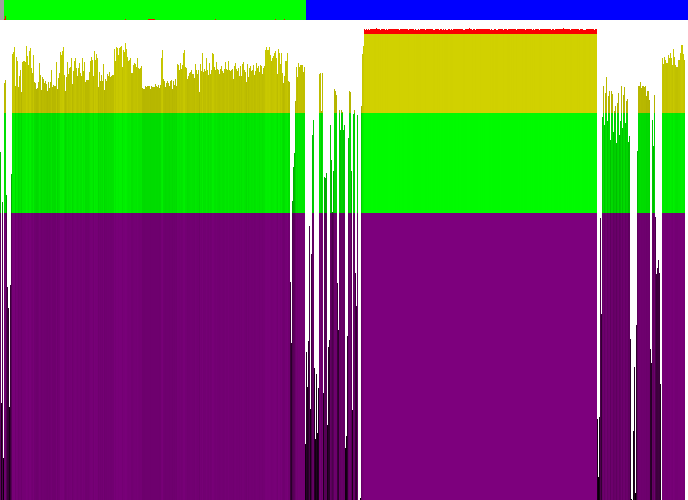
Vista calc.exe:
1) The headers are noticeably separated from the code section
2) The code section is not encrypted with a non-trivial cipher
3) Around 291 pixel (12300h) the entropy is low, is probably IAT, after which (high entropy again) the function names occurs (it's hard to explain that phenomena in any other way ;>)
4) A large portion of data is either encrypted or compressed (in fact it's a 256x256x32 PNG image of a calculator)
5) At the end of the file there are some headers and some text
6) Probably the most of the blue section contains resources (icons, dialogs, etc)

Some malware packed with PEncrypt 3.1 (a downloader):
1) The first green section is compressed/encrypted
2) The second green sections is not, and probably it contains a loader
3) the data section is not encrypted

The app from Hackerchallenge 2008 Phase 3:
1) Three different parts of code is encrypted, probably separately
2) The data section is encrypted OR (judging on a constant entropy of that fragment) it contains some keys or arrays of constants for some cipher algorithm (afair AES constats and the key was there)
3) At the end of the file some constant padding is places (the constant entropy, it's in fact a repeatable string XPADDINGX, placed by the compiler)
By the way...
If want to improve your binary file and protocol skills, check out the workshop I'll be running between April and June → Mastering Binary Files and Protocols: The Complete Journey
And thats that. As a final word I'll says that I'm using the entropy chart at work for about 2 years now, and it's really have sped up the analysis of a few things - a quick chart generation, a single look on the chart, and one knows (with a large probability):
1) Is the file encrypted?
2) Where are the encrypted parts?
3) Where is the text/strings?
4) How is it distributed?
It gives one quite a boots at the very beginning of the analysis ;>


Comments:
ABCDEF and ADBFEC have differing entropy, but in your
formula they have the same.
You disagree with my explanation on how does my entropy monitor work? Interesting.
I'm almost sure I know how I coded it. And also, I'm sure I've mentioned that my formula is simplified and does not catch all the correlations. So, what are you disagreeing with? ;>
because sequence effects should (at least IMHO) be taken
into account when calculating entropy estimates.
Although I must confess that I’m a little into entropy for
cryptographic and similar means, not for code analysis,
so your formula probably works “good enough” for the
application.
In that case I agree with you! It should take as many factors as possible into account, and it's not because my lack of time when I was creating the tool. It may be sufficient for code analysis, however it still would benefit from a better formula.
I'm thinking about creating a second version of this tool - it will contain a better formula ;>
Add a comment: